12 Oct 2026
Exploring Connections Between ACH Transfer Volumes and Tailored Capital Structures for Regional Service Providers
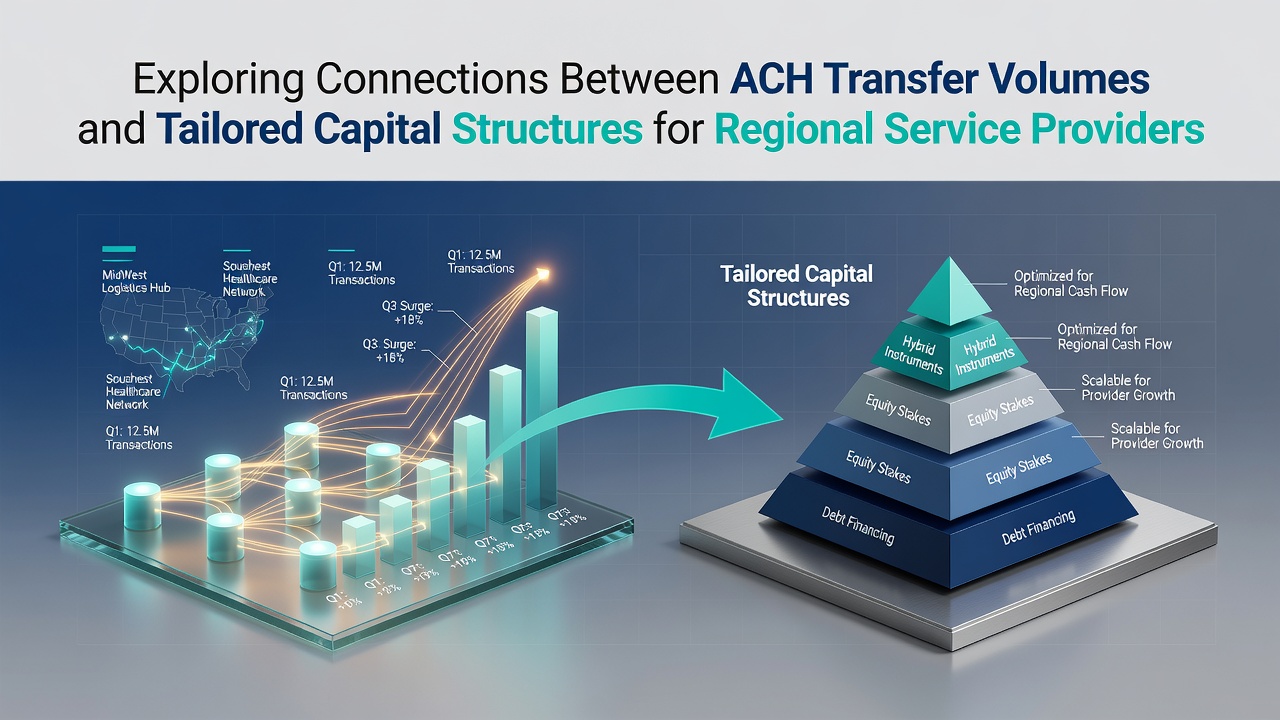
Regional service providers across the United States rely on Automated Clearing House networks for payroll disbursements, vendor payments, and recurring collections, and observers note that rising ACH transfer volumes often signal predictable cash inflows that lenders examine when designing customized capital arrangements. Data from October 2026 indicates continued growth in ACH activity, with the Federal Reserve reporting steady increases in both credit and debit transfers processed through regional banks that serve utilities, healthcare clinics, and municipal contractors.
ACH Volume Patterns Among Regional Operators
Service providers in mid-sized markets generate substantial ACH activity through customer billing cycles and supplier settlements, yet patterns vary by sector because healthcare entities process frequent incoming credits while construction firms handle larger outgoing debits for equipment leases. Researchers at regional Federal Reserve branches have tracked how volume spikes during tax collection periods correlate with improved liquidity metrics that banks later use to adjust loan covenants. Those who monitor settlement files observe that consistent weekly ACH inflows above certain thresholds allow providers to negotiate revolving facilities with interest rates tied directly to transfer reliability rather than traditional collateral ratios.
One case involved a group of rural water districts whose combined ACH collections exceeded prior-year figures by measurable margins, prompting lenders to restructure existing term debt into hybrid instruments that blended fixed and variable components based on projected transfer growth. Such adjustments reflect broader industry shifts where data on transfer frequency and average ticket size inform risk models more precisely than balance-sheet snapshots alone.
Linking Transfer Data to Capital Design
Financial institutions increasingly incorporate ACH analytics into underwriting platforms because elevated transfer counts demonstrate operational scale and customer retention, elements that support tailored amortization schedules or grace periods aligned with seasonal billing. Studies from academic centers examining community bank portfolios show that providers maintaining steady ACH throughput receive capital structures featuring lower origination fees and extended draw periods compared with peers whose payment activity fluctuates sharply. This connection becomes evident when analysts segment datasets by geography, revealing that providers in agricultural regions leverage harvest-related ACH surges to secure equipment financing lines that reset quarterly according to volume forecasts.
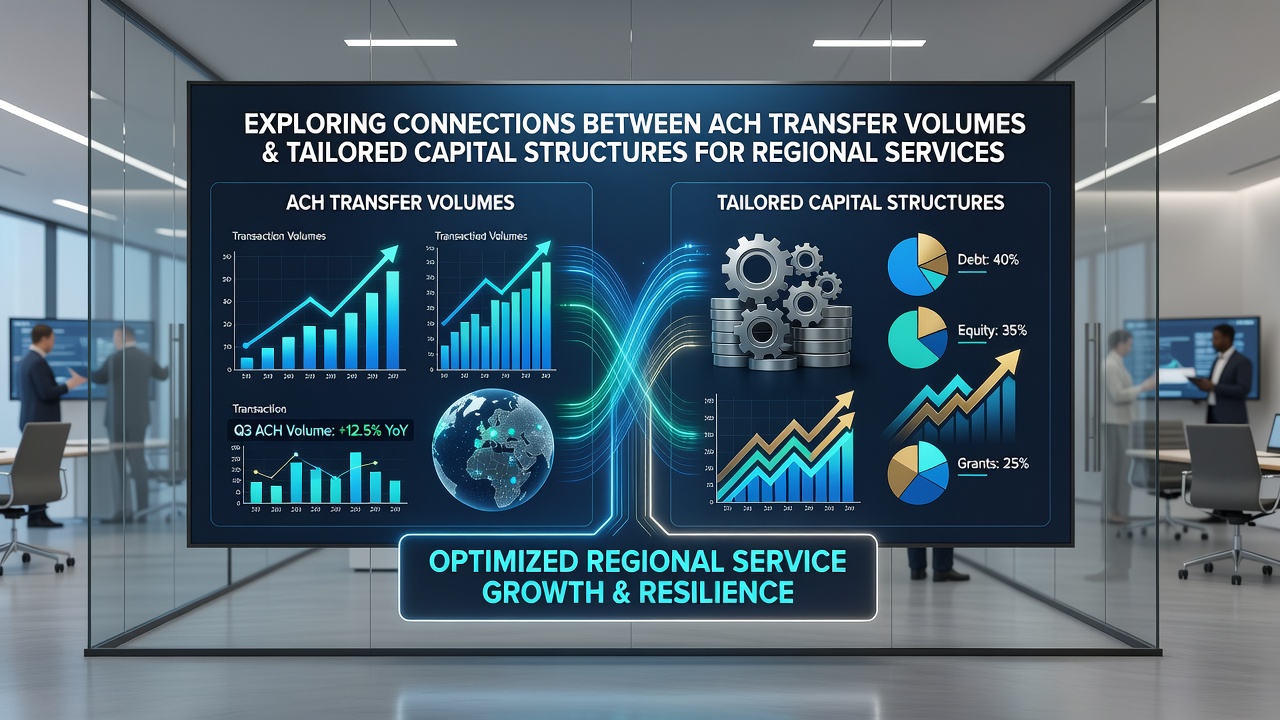
Regional service providers also benefit when ACH data feeds into dynamic pricing frameworks that recalibrate interest margins if monthly transfer totals remain within projected bands. Observers note that this approach reduces refinancing events because covenants adapt to actual transaction behavior rather than static projections, and figures released by the Federal Reserve confirm that such adaptive structures have appeared more frequently in portfolios since 2024.
Implementation Across Service Sectors
Healthcare networks in the Midwest have used ACH volume histories to obtain working-capital facilities sized to average daily collections, allowing draws that match payroll cycles without fixed monthly minimums. Municipal contractors in the South similarly reference transfer records when negotiating performance bonds that incorporate volume-based release clauses, freeing capital as project-related ACH payments clear. These examples illustrate how payment data streams translate into financing terms that accommodate operational realities specific to each region and service type.
Payment processors and core banking providers supply aggregated ACH reports that highlight concentration risks, such as over-reliance on a few large payers, enabling providers to diversify collection methods before seeking additional capital. When concentration metrics improve alongside volume growth, lenders respond with multi-tiered facilities that combine senior debt with subordinated tranches linked to continued transfer performance.
Regulatory and Reporting Considerations
Compliance frameworks require detailed ACH reporting under rules maintained by NACHA and enforced through bank examinations, and service providers that maintain clean origination records often qualify for expedited capital approvals because regulatory scrutiny already validates transaction integrity. Data shared by the Bank of Canada on similar batch payment systems suggests parallel trends in cross-border comparisons, where volume transparency supports more granular risk pricing for regional operators. Providers that integrate these reporting outputs into capital discussions demonstrate reduced operational friction, allowing structures that align repayment schedules with verified transfer dates rather than arbitrary calendar milestones.
Conclusion
Connections between ACH transfer volumes and capital structures continue to evolve as regional service providers supply richer transaction datasets to lenders, and patterns observed through October 2026 point toward wider adoption of volume-linked terms across utility, healthcare, and municipal sectors. Institutions that refine models around these flows produce arrangements better matched to actual cash movement, while providers gain access to facilities that scale with demonstrated payment activity. The result is a financing environment shaped increasingly by verifiable transfer metrics rather than conventional financial ratios alone.